Washington Pass

What is this?
This plot shows accumulated snow for Washington Pass from the West-WRF ensemble from the Center for Western Weather and Water Extremes at UC San Diego. West-WRF is an ensemble of 200 member models with 9km horizontal grid resolution (9km x 9km grid cells) run from October-March. It was developed primarily to forecast high-intensity winter precipitation (especially during atmospheric rivers) and recent studies have shown it to perform better than the GEFS (US) and as well or better than the ECMWF ensemble ( Delle Monache et al. 2025 ).
How to use:
Look at the range of the ensemble members (also called ensemble spread) to evaluate the uncertainty in the forecast. Larger spread implies lower confidence in the forecast.
Source:
https://cw3e.ucsd.edu/west-wrf_ensemble_meteograms
What is this?
This plot shows precipitation (rain + snow water equivalent) for Washington Pass from the West-WRF ensemble from the Center for Western Weather and Water Extremes at UC San Diego. West-WRF is an ensemble of 200 member models with 9km horizontal grid resolution (9km x 9km grid cells) run from October-March. It was developed primarily to forecast high-intensity winter precipitation (especially during atmospheric rivers) and recent studies have shown it to perform better than the GEFS (US) and as well or better than the ECMWF ensemble ( Delle Monache et al. 2025 ).
How to use:
Look at the range of the ensemble members (also called ensemble spread) to evaluate the uncertainty in the forecast. Larger spread implies lower confidence in the forecast.
Source:
https://cw3e.ucsd.edu/west-wrf_ensemble_meteogramsWhat is this?
This plot shows accumulated snow and precipitation for Washington Pass from the Utah Snow Ensemble from the University of Utah. The Utah Snow Ensemble includes the GEFS (US) and ECMWF EPS (European) ensembles and some fancy math (statistical downscaling) to produce these forecasts.
How to use:
Look at the range of the ensemble members (also called ensemble spread) to evaluate the uncertainty in the forecast. Larger spread implies lower confidence in the forecast. The bottom left panel shows the wet-bulb temperature 0.5°C level, which generally corresponds to the rain/snow level.
Source:
https://weather.utah.eduWhat is this?
This plot shows accumulated snow and precipitation for Washington Pass from the Rapid Refresh Forecast System (RRFS) Ensemble. The RRFS Ensemble is NOAA's next generation, convection-allowing ensemble forecast system. It is run out 60 hours (2.5 days) at 3km horizontal grid resolution, rerun every 6 hours.
How to use:
Look at the range of the ensemble members (also called ensemble spread) to evaluate the uncertainty in the forecast. Larger spread implies lower confidence in the forecast. The bottom left panel shows the wet-bulb temperature 0.5°C level, which generally corresponds to the rain/snow level.
Source:
https://weather.utah.edu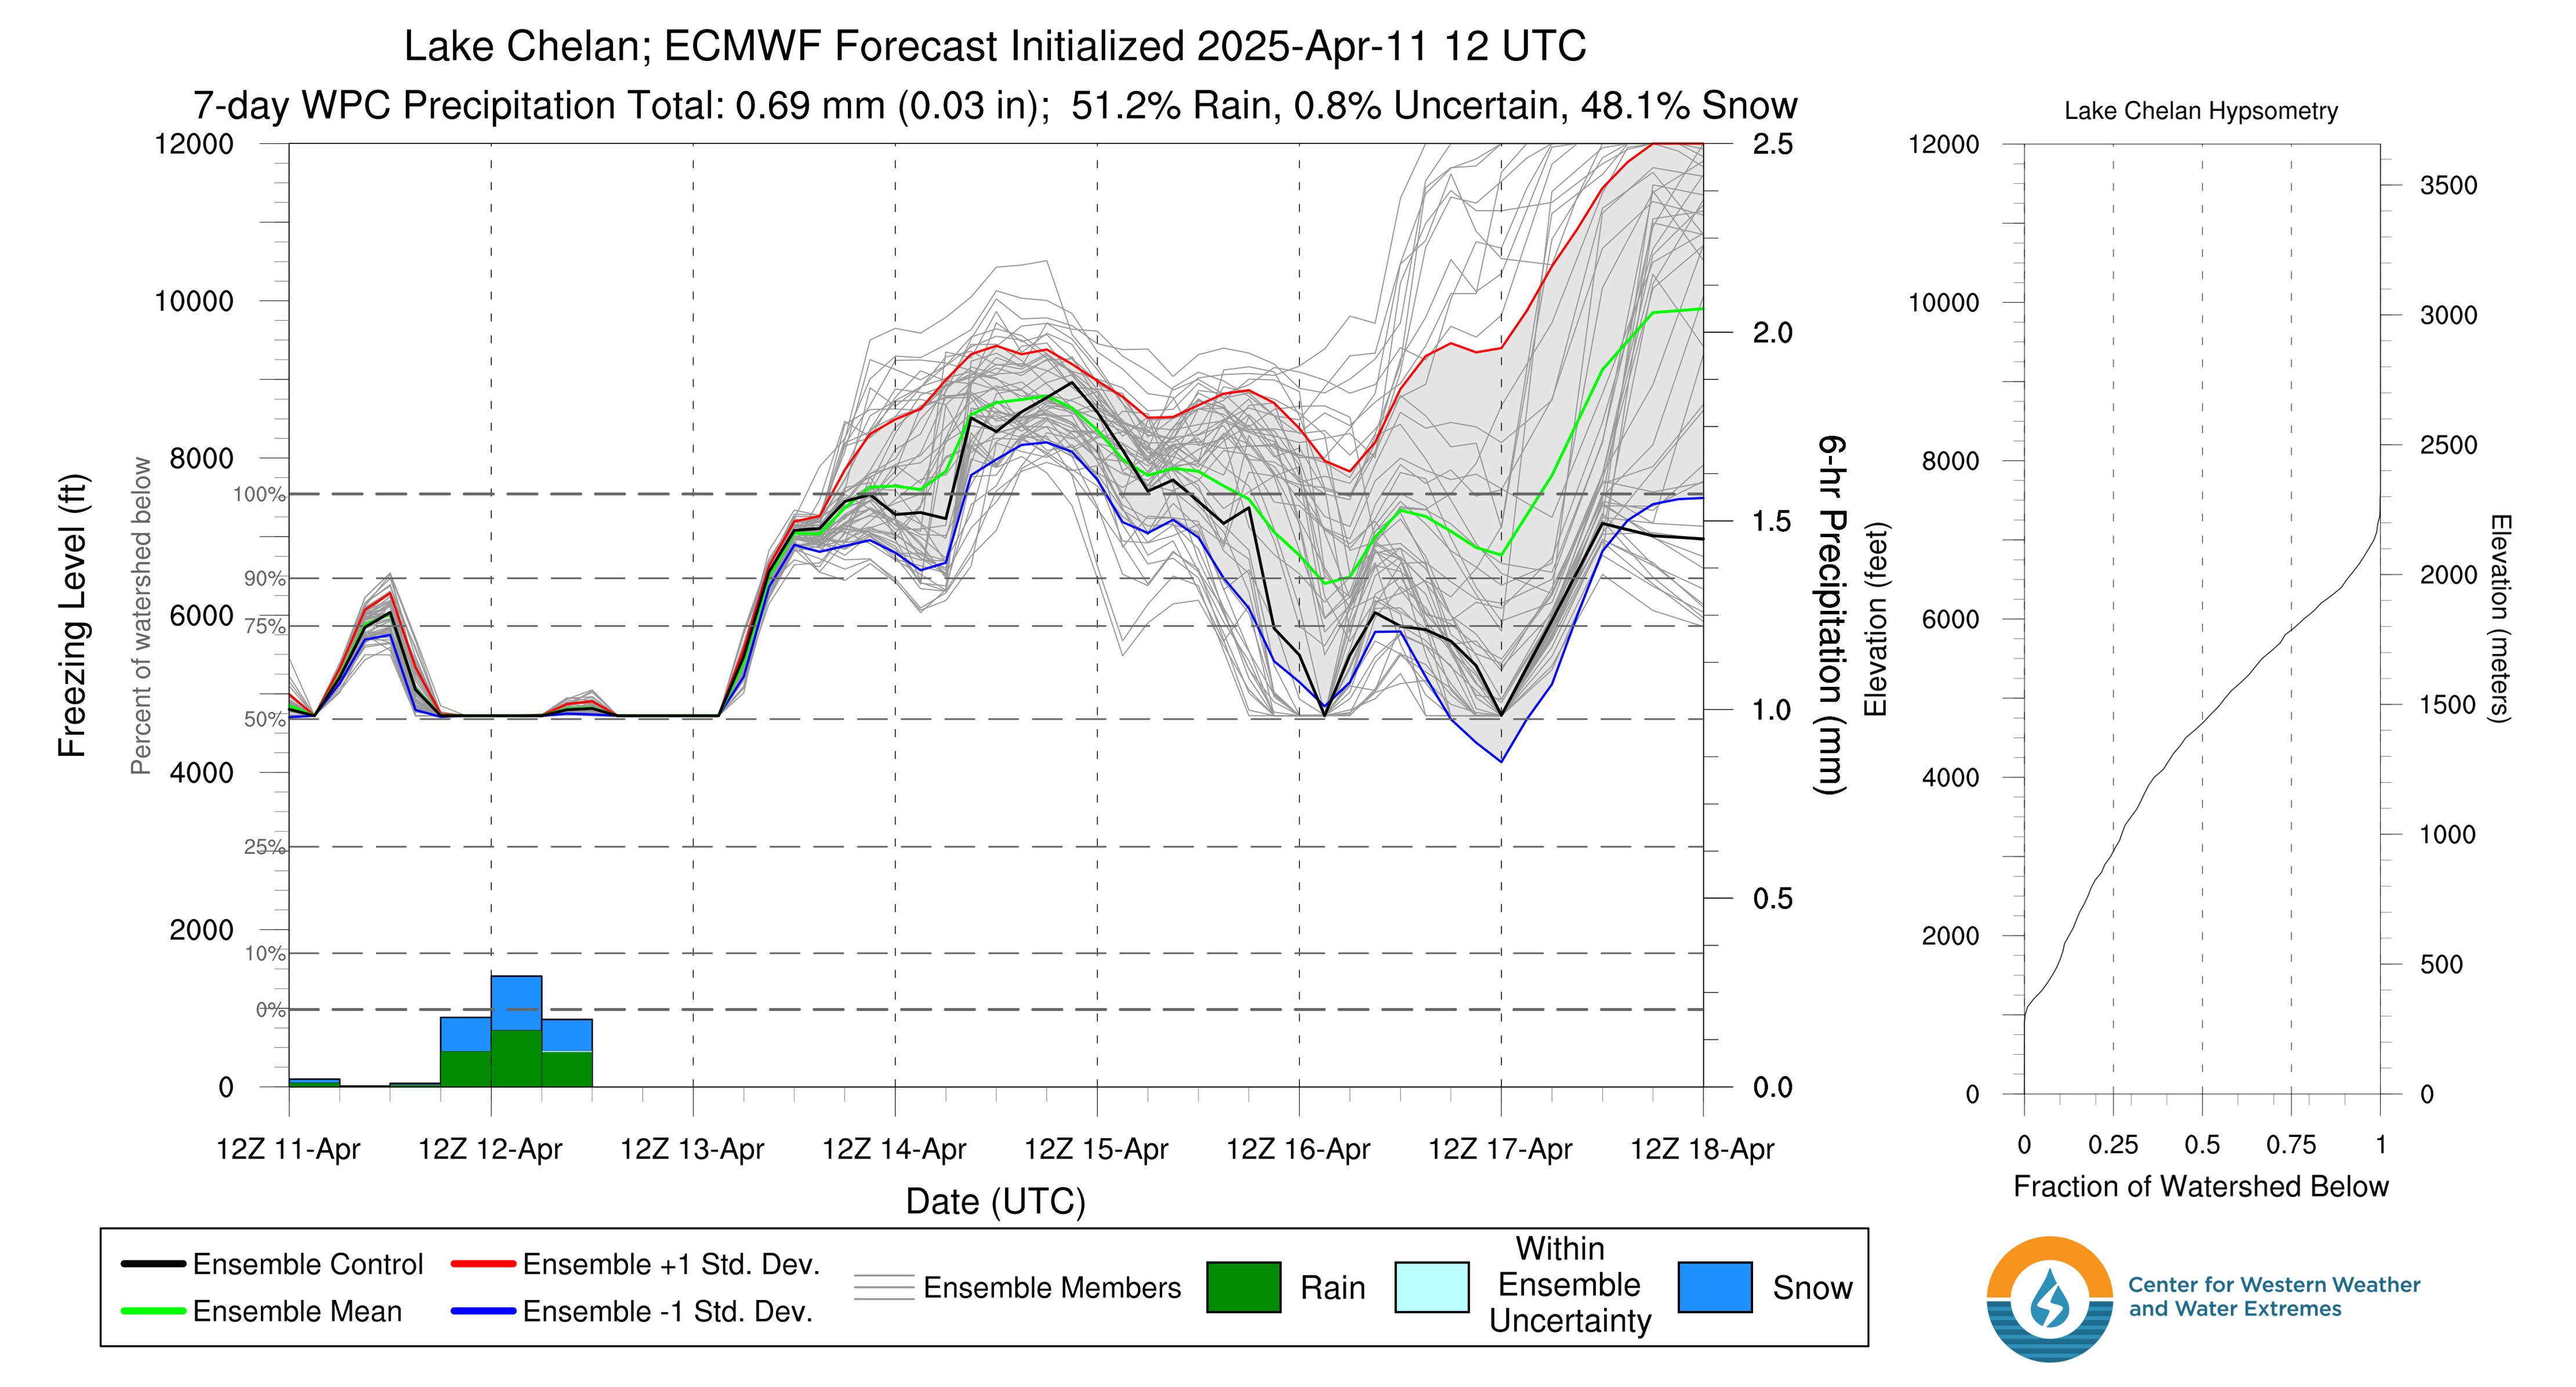
What is this?
This image shows the ECMWF (European) ensemble forecast for freezing levels on the west side of Washington Pass (Lake Chelan Watershed). Each light gray line represents a single model within the ensemble. The bar plot shows 6hr precipitation totals averaged across the whole watershed with colors representing what percentage of the watershed will see snow vs. rain during that time period.
How to use:
Tightly spaced model lines imply high model agreement which can give us more confidence in the forecast while widely spaced lines mean higher uncertainty. It can be helpful to look at the ensemble mean (light green line) and the +/- 1 standard deviation ensemble spread (gray shading between red and blue lines) to better understand model uncertainty.
Source:
https://cw3e.ucsd.edu/DSMaps/DS_freezing.html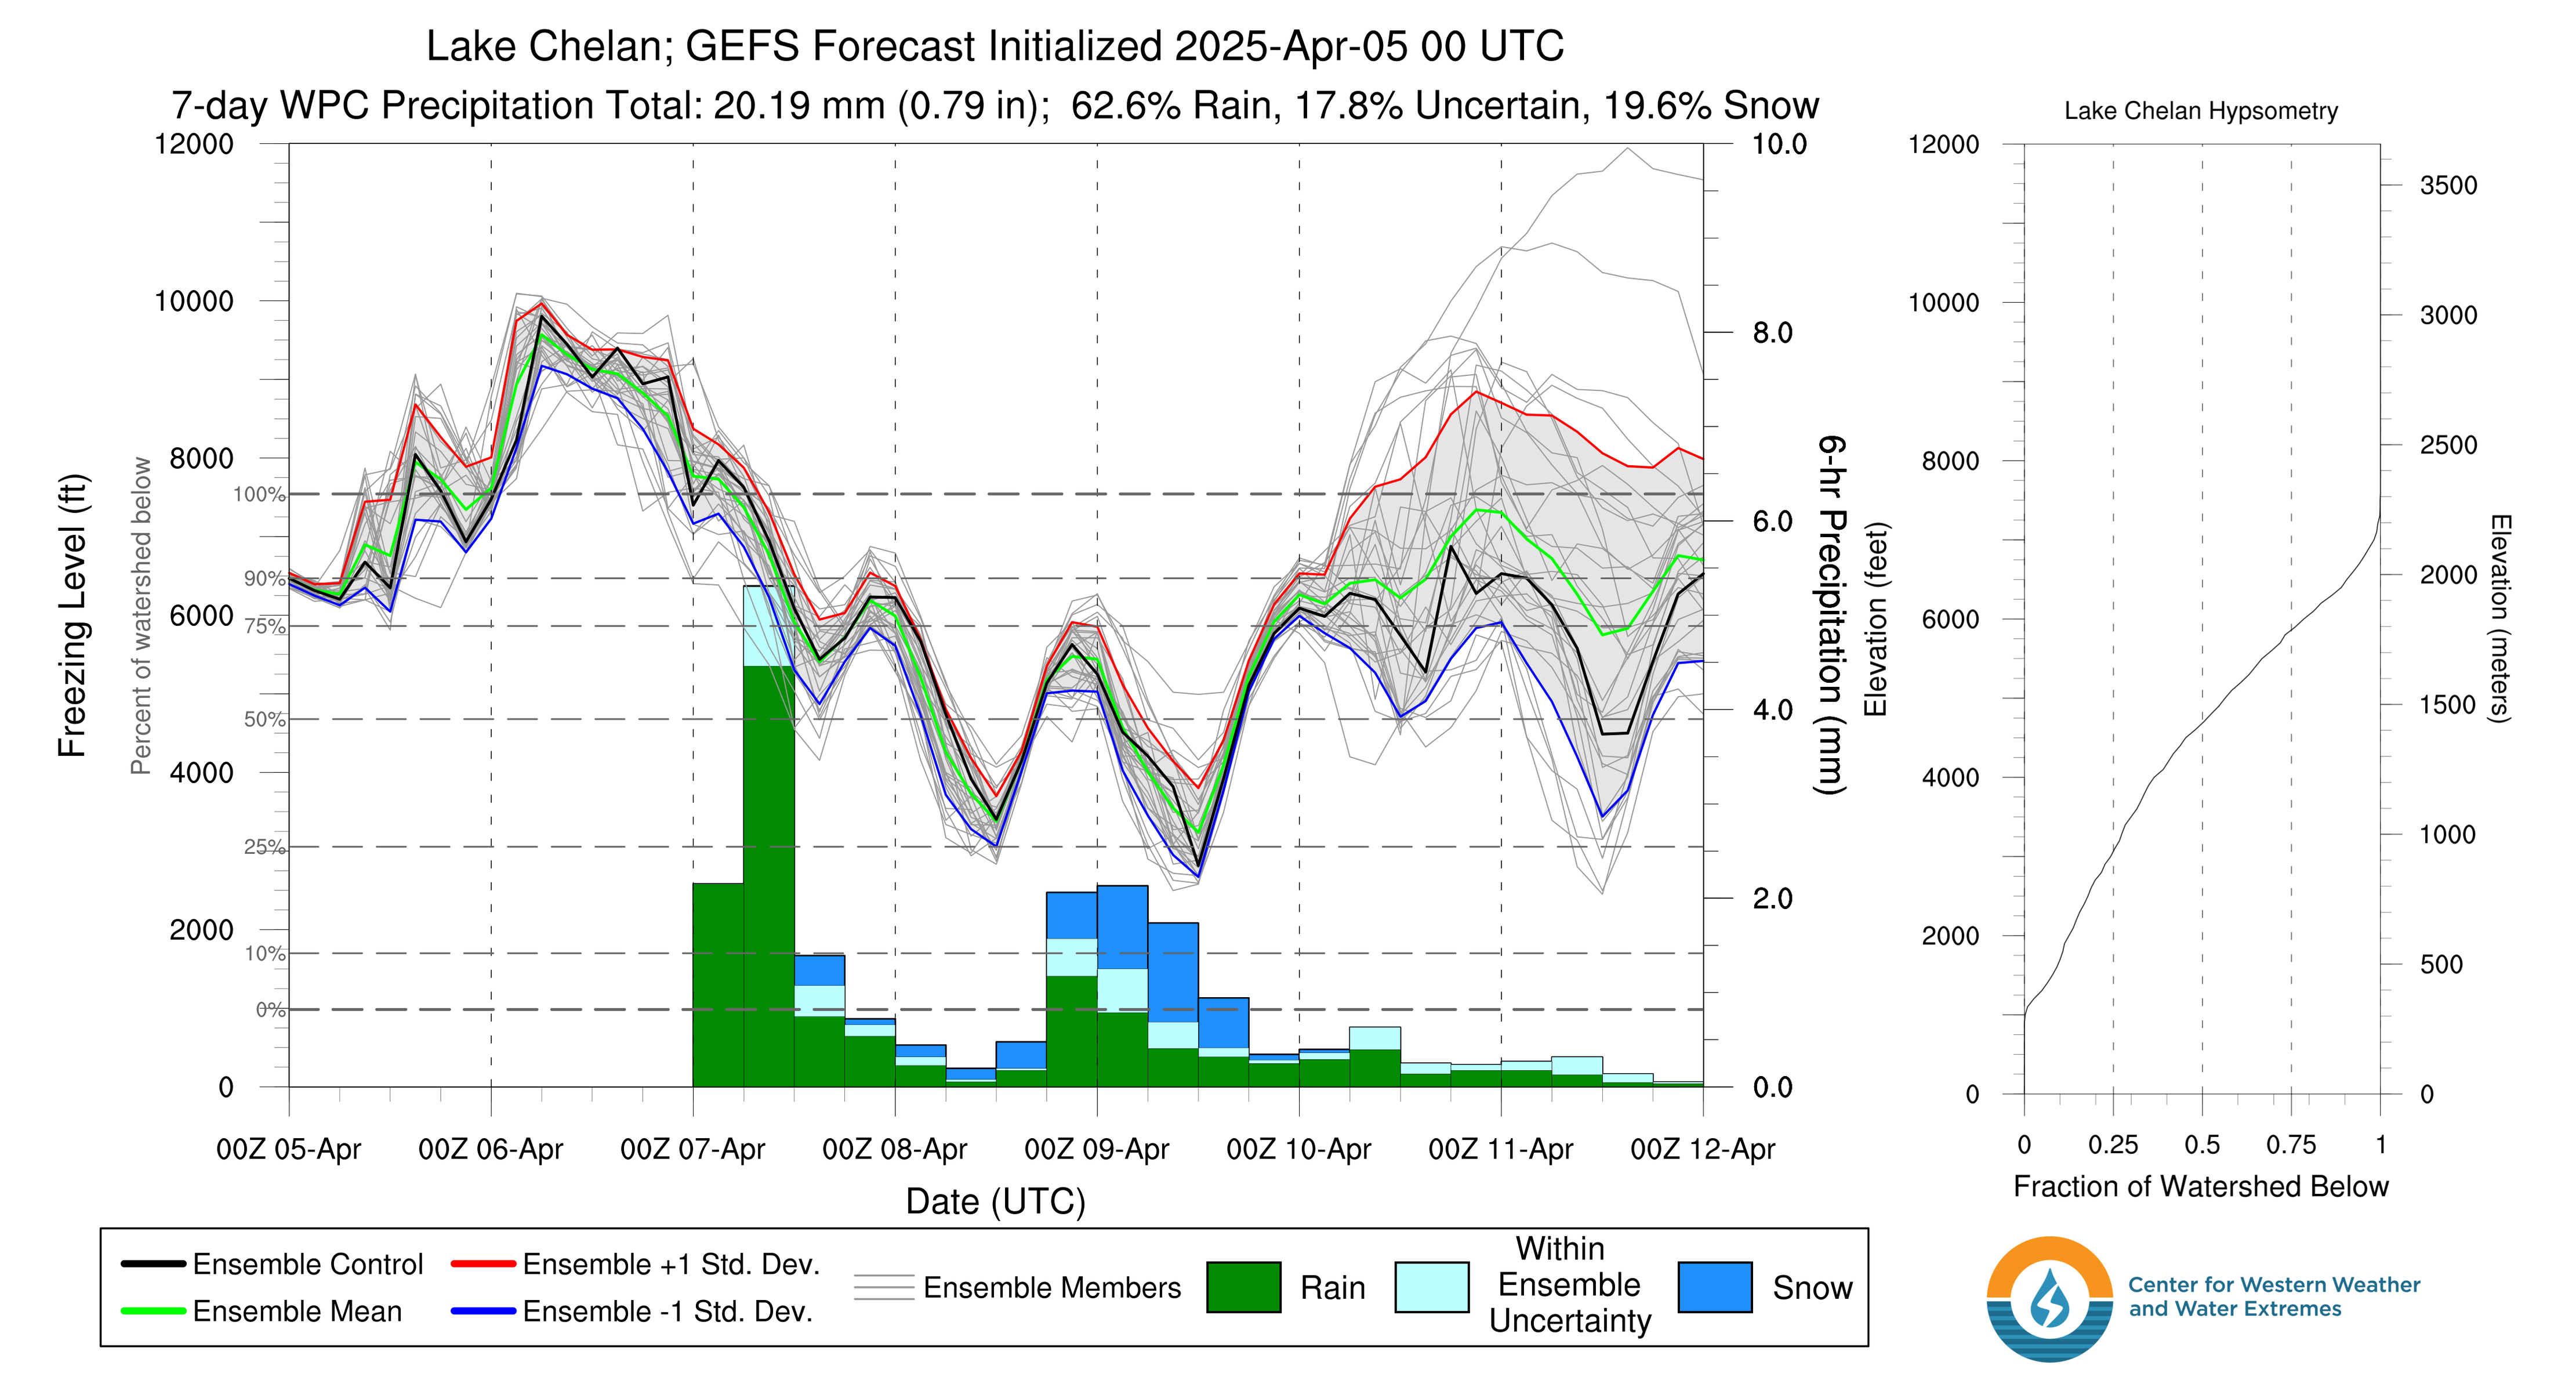
What is this?
This image shows the GEFS (American) ensemble forecast for freezing levels on the west side of Washington Pass (Lake Chelan Watershed). Each light gray line represents a single model within the ensemble. The bar plot shows 6hr precipitation totals averaged across the whole watershed with colors representing what percentage of the watershed will see snow vs. rain during that time period.
How to use:
Tightly spaced model lines imply high model agreement which can give us more confidence in the forecast while widely spaced lines mean higher uncertainty. It can be helpful to look at the ensemble mean (light green line) and the +/- 1 standard deviation ensemble spread (gray shading between red and blue lines) to better understand model uncertainty.
Source:
https://cw3e.ucsd.edu/DSMaps/DS_freezing.html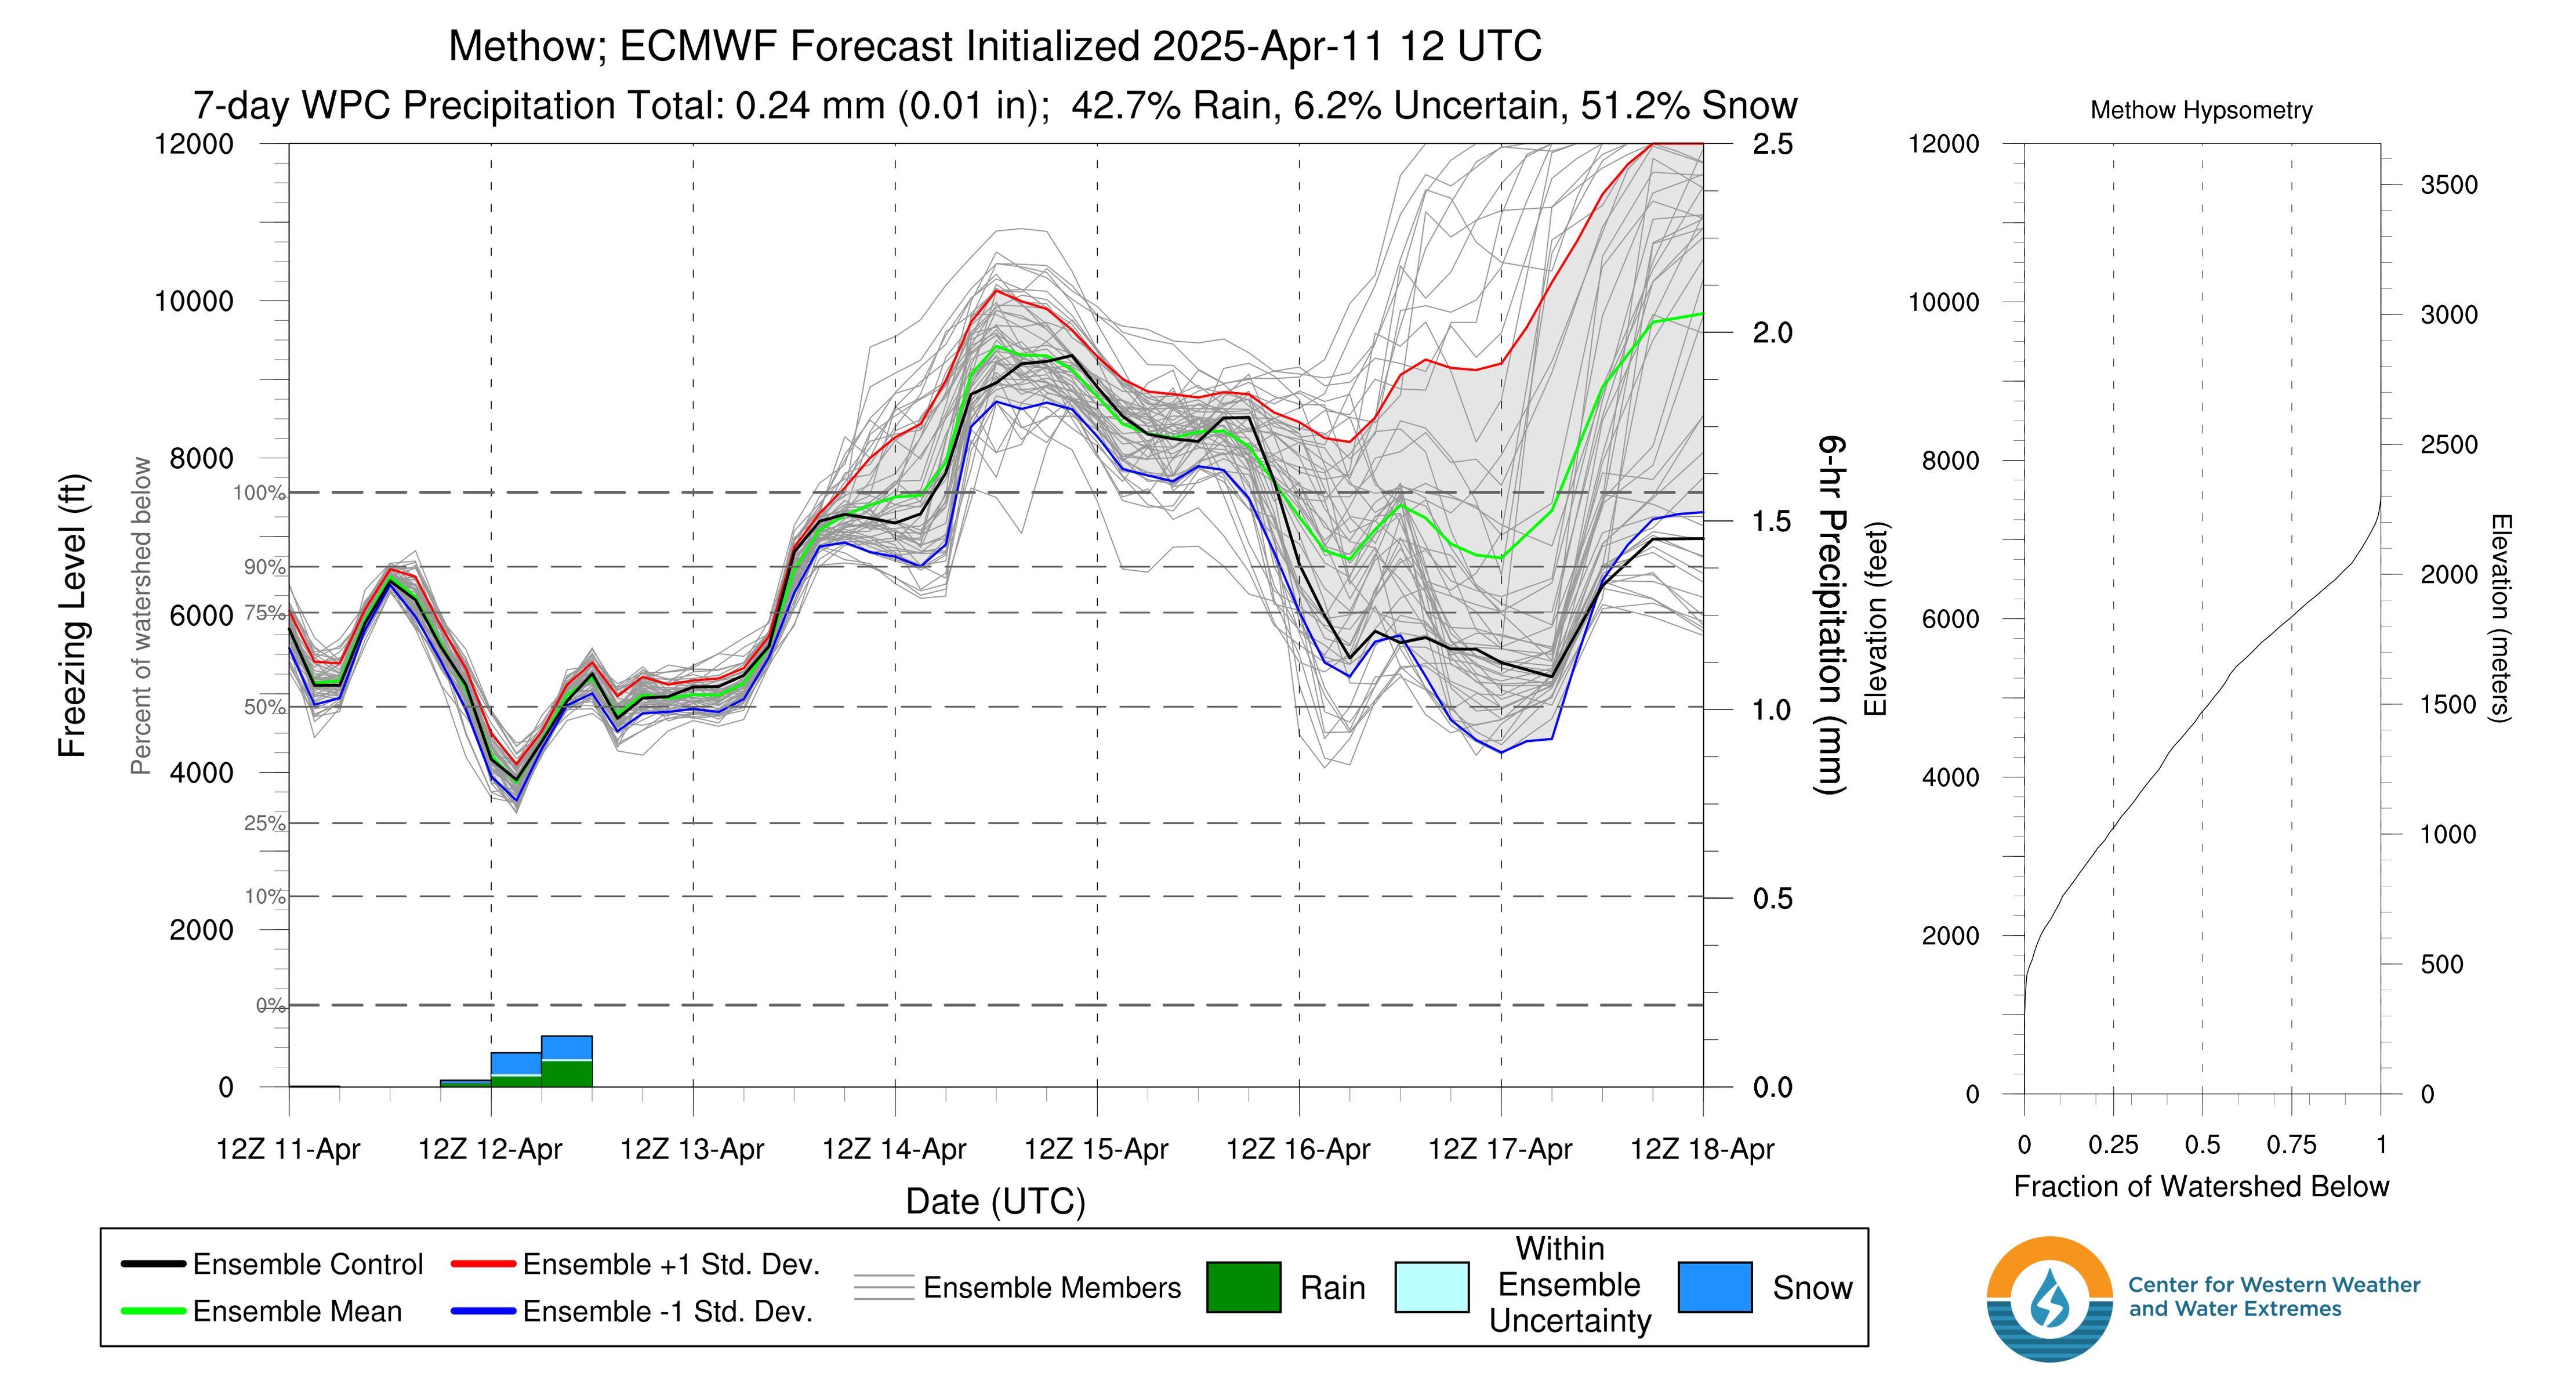
What is this?
This image shows the ECMWF (European) ensemble forecast for freezing levels on the east side of Washington Pass (Methow River Watershed). Each light gray line represents a single model within the ensemble. The bar plot shows 6hr precipitation totals averaged across the whole watershed with colors representing what percentage of the watershed will see snow vs. rain during that time period.
How to use:
Tightly spaced model lines imply high model agreement which can give us more confidence in the forecast while widely spaced lines mean higher uncertainty. It can be helpful to look at the ensemble mean (light green line) and the +/- 1 standard deviation ensemble spread (gray shading between red and blue lines) to better understand model uncertainty.
Source:
https://cw3e.ucsd.edu/DSMaps/DS_freezing.html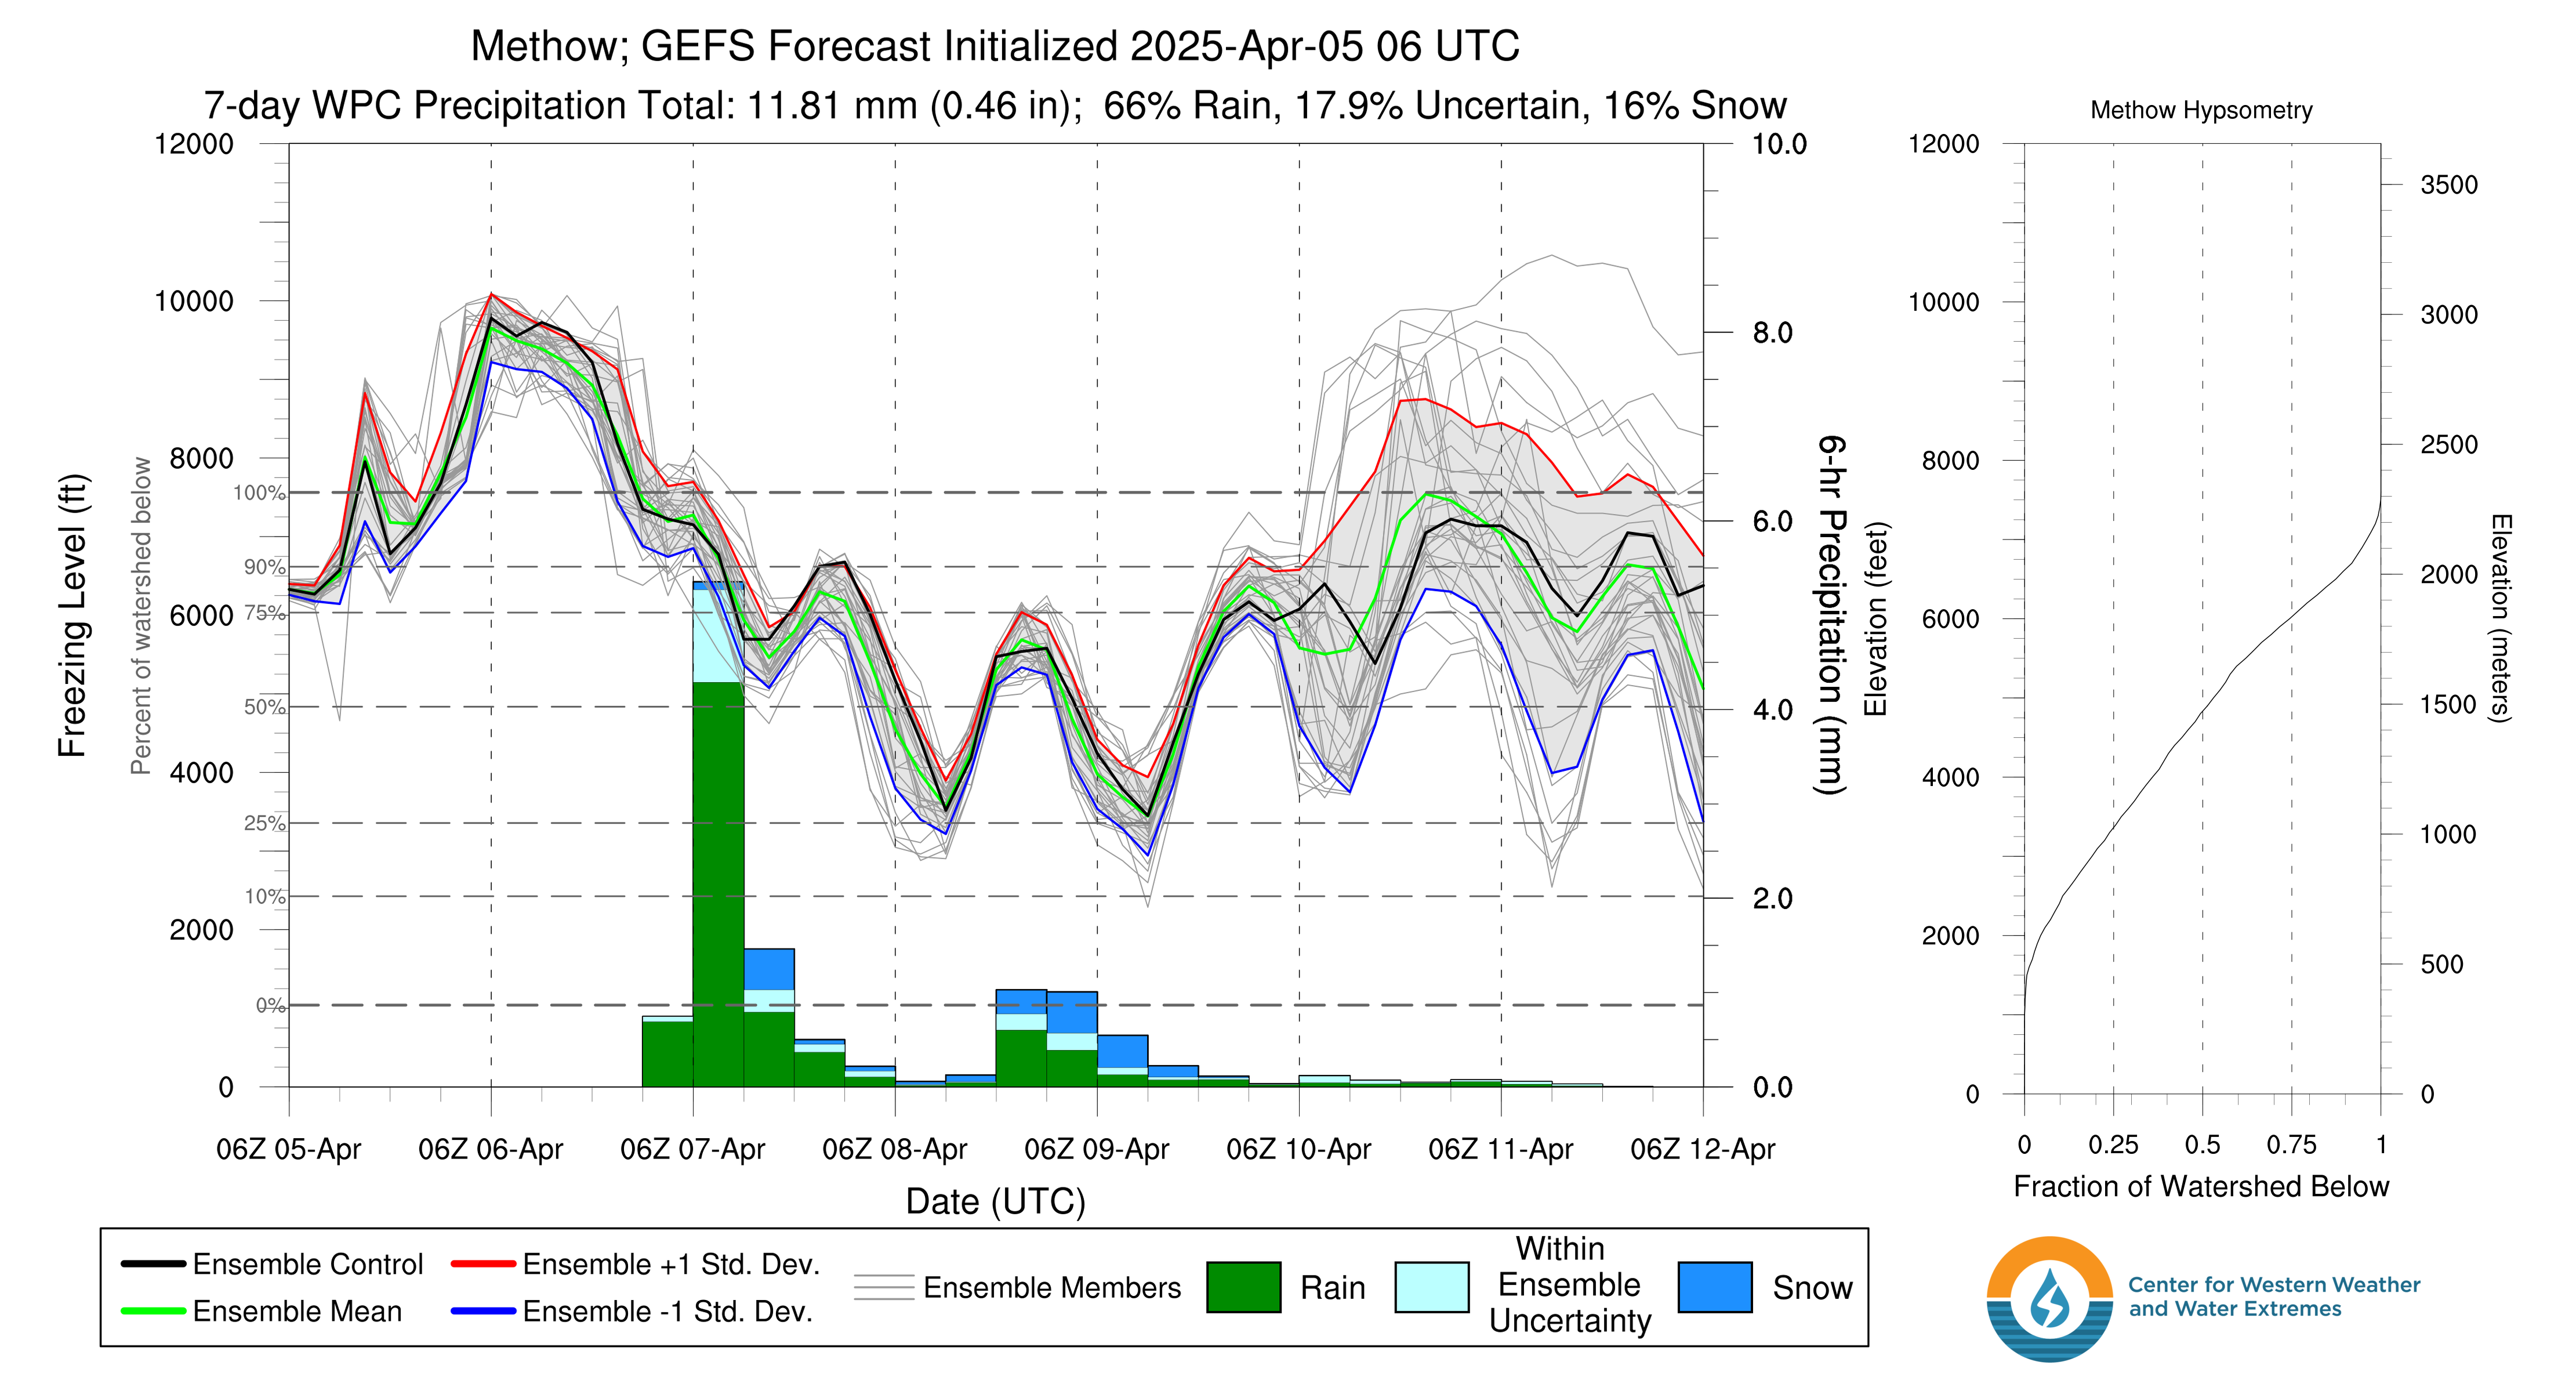
What is this?
This image shows the GEFS (American) ensemble forecast for freezing levels on the east side of Washington Pass (Methow River Watershed). Each light gray line represents a single model within the ensemble. The bar plot shows 6hr precipitation totals averaged across the whole watershed with colors representing what percentage of the watershed will see snow vs. rain during that time period.
How to use:
Tightly spaced model lines imply high model agreement which can give us more confidence in the forecast while widely spaced lines mean higher uncertainty. It can be helpful to look at the ensemble mean (light green line) and the +/- 1 standard deviation ensemble spread (gray shading between red and blue lines) to better understand model uncertainty.