
Powder Stash Predictor
This tool matches current deterministic and ensemble-based ECMWF forecasts with characteristic storm analogs, characteristic storm signatures that often produce certain precipitation patterns (see further description below). This can help indicate which locations may get more (or less) precipitation than other places, all things being equal. If no pattern is called out, there either is no storm or the signal is too weak to be meaningful.
For example, during a "normal" storm, Mt. Baker gets more precipitation than most places. But when the forecast aligns with, let's say, pattern 0, it suggests that Mt. Baker will get even more precipitation than normal relative to other sites (a.k.a. a "precipitation bonus"). In other words, the forecast is more favorable for Mt. Baker than it is for other locations.
But remember, these are analogs, meaning that although a given pattern may be similar to an analog, the actual impact could disagree with an overall forecast. Use it as another tool in the toolbox.
How this works, and the six storm patterns
- Storm days. We took the 2,111 days from November 15 to April 30, 1992 to 2026 when all SNOTEL sites in the Washington Cascades averaged at least a quarter inch of new water. Mt. Hood is scored against the Washington zones in the same way, but it does not help decide what counts as a storm day.
- Six patterns. On each of those storm days we found the region's lowest 500 hPa height anomaly in the ERA5 reanalysis, noted how deep it was and where it sat. We clustered each day into six patterns by those three numbers (intensity displacement clustering).
- Over- and under-performing. For each zone and storm day we asked whether the zone got at least half an inch more water than usual for a storm of that size (over), or half an inch less (under), then counted how often that happened in each pattern.
- The forecast. We take ECMWF 500 hPa height anomaly and find the lowest low-pressure system in the region. We assign this to the nearest pattern if it is within a certain distance. Days are labelled dry, slightly wet (under half an inch), moderately wet (half an inch to an inch and a half) or very wet (more).
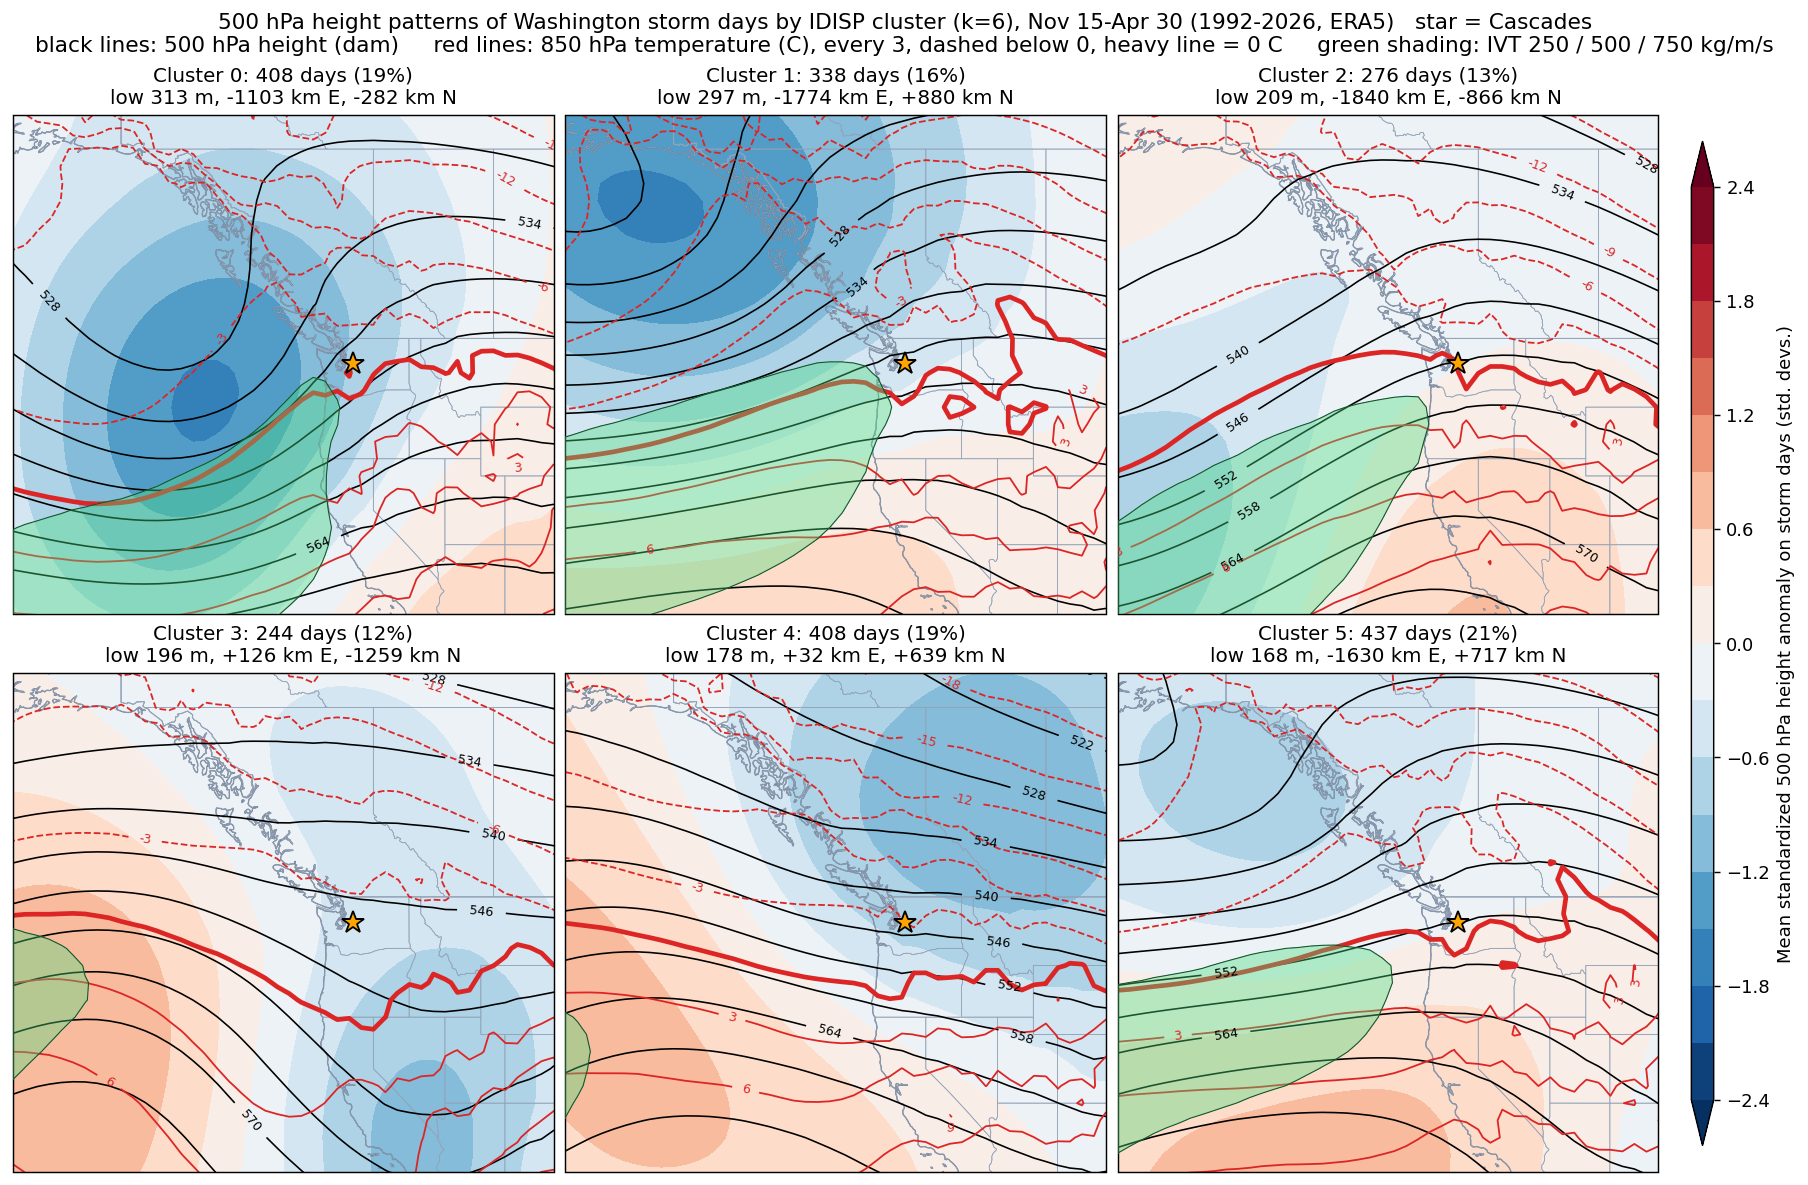
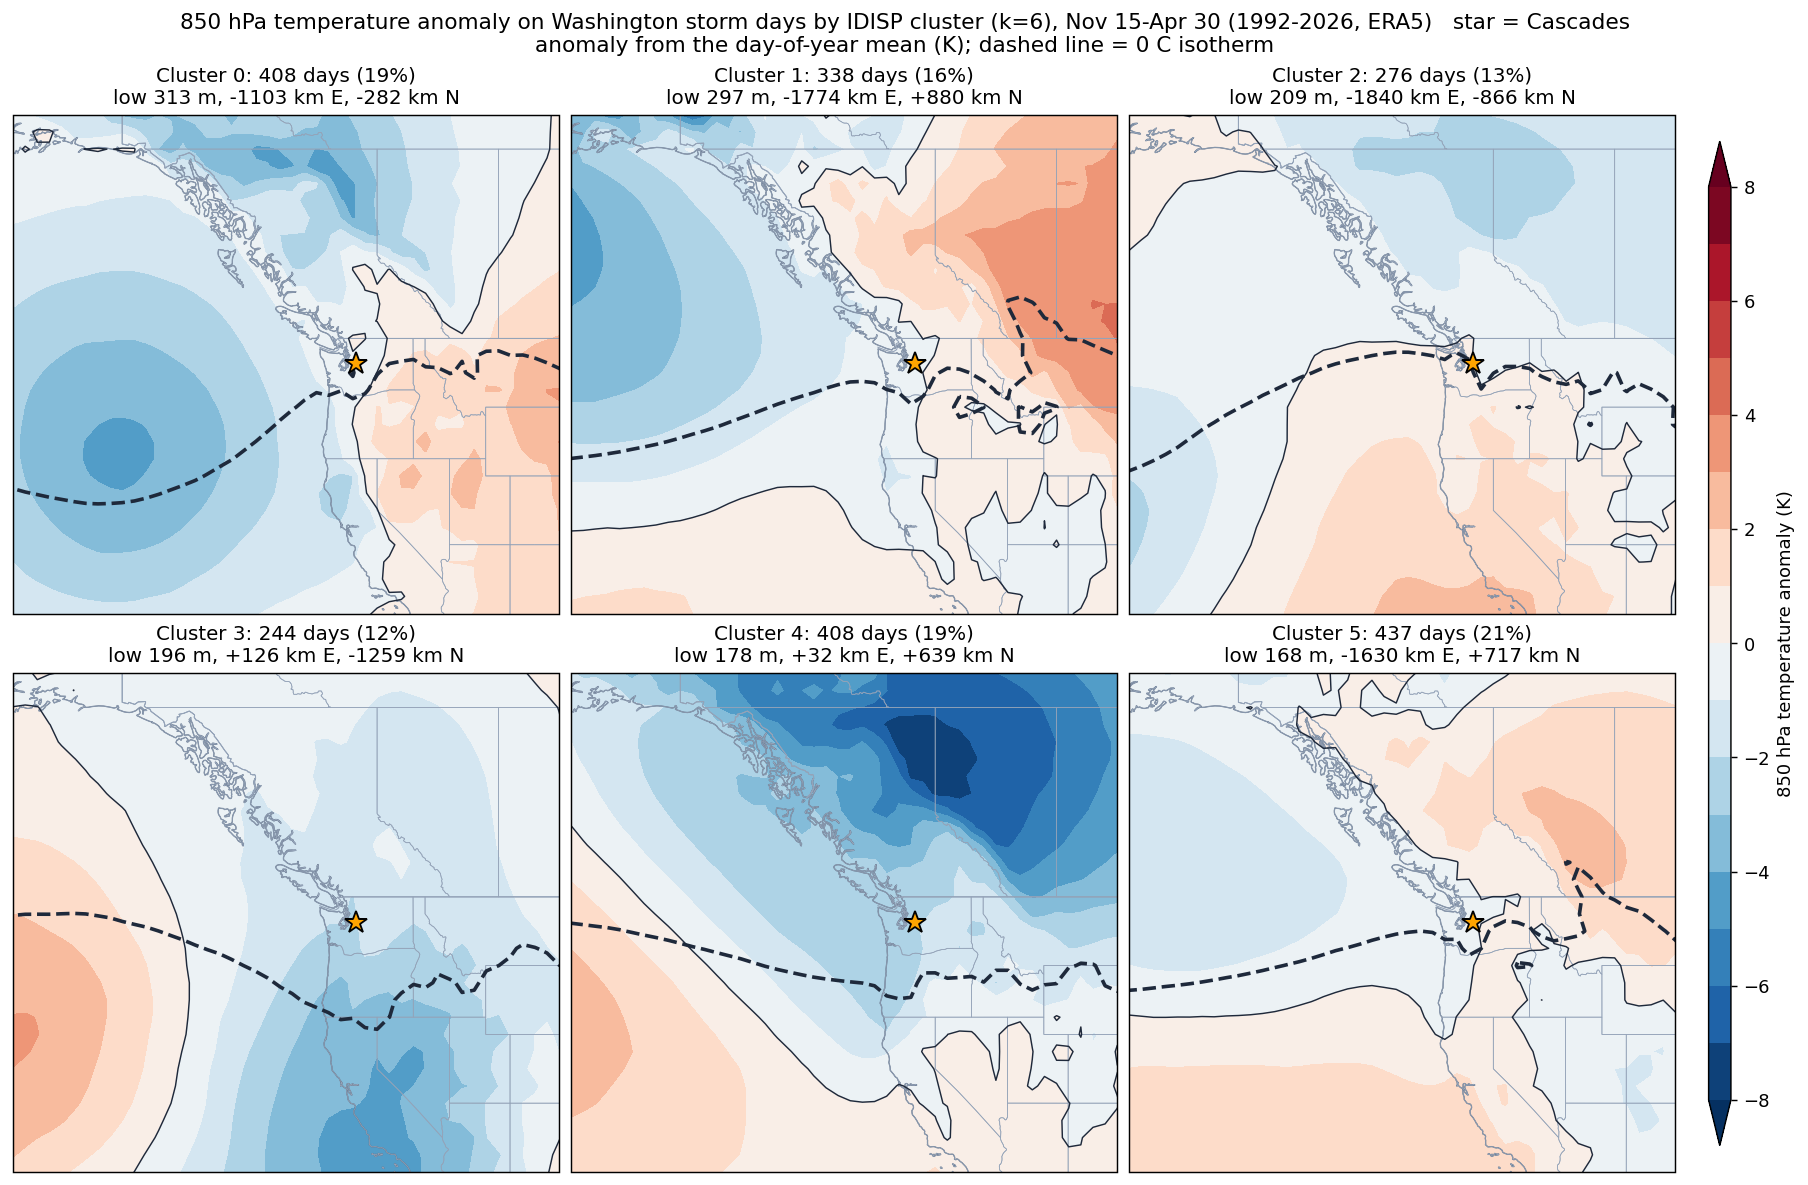
- The limits: six groups are a simplification of a many patterns. Refitting on resampled data reproduces the grouping only moderately (adjusted Rand index of about 0.7, where 1 is identical), and some output will be chance. The forecast uses ECMWF's open data: the deterministic run is one forecast, and the ensemble mean smooths out features the members disagree on. The patterns say where a storm may over/underperform, not how much precipitation will fall.