Teleconnections
Large, slow patterns in the ocean and atmosphere that tend to nudge the odds for Washington’s winter weather. They are tendencies, not guarantees: any single winter can break the pattern.
Climate index explorer: ENSO and PDO
Two monthly indices side by side. Pick ENSO (the Oceanic Niño Index), the PDO, or overlay both with a separate axis for each, and choose how far back to look. Both update once a month.
Loading the index data…
What the indices did to Washington snow, station by station
We matched 36 Washington SNOTEL stations (30 to 45 years of record, from 3,000 to 6,500 feet) with the MJO, the PNA and ENSO, November through May, 1992 to 2026. Pick an index, a measure and an elevation group to see which phases brought the most snow, the biggest storms, the warmest and coldest days and the most rain, and where in the state. These are averages over many winters, so they shift the odds; they do not forecast a storm.
Loading…
El Niño / La Niña (ENSO)
The state of the tropical Pacific. La Niña winters tend to lean cooler and wetter in the Pacific Northwest, and El Niño winters tend to lean warmer. The effect is modest and varies from year to year.
The Oceanic Niño Index (ONI) is the three-month average sea surface temperature anomaly in the central tropical Pacific (the Niño 3.4 region). Values of +0.5°C or more are in the El Niño range and −0.5°C or less in the La Niña range; the farther from zero, the stronger the event. The chart above shows it back to 1950. NOAA declares an event using more than this one number, so check the CPC discussion for the official status.
Current status: CPC ENSO diagnostic discussion and the Oceanic Niño Index.
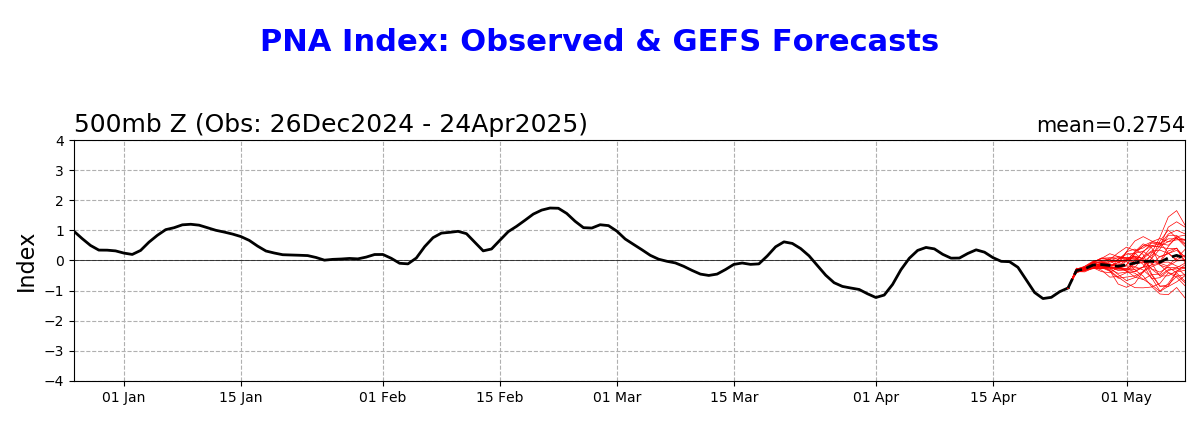
Pacific–North American pattern (PNA)
A pattern of upper-level pressure over the Pacific and North America, which changes over weeks. A positive phase tends to put a ridge over the West and a trough over the East; a negative phase tends to favor a trough and more active weather in the Pacific Northwest.
Seasonal outlook
Where the PNA is headed over the coming months, from the ECMWF seasonal system. Each month shows the forecast ensemble (purple boxes) against the model’s own climate (gray) and the observed range (yellow and orange). Purple sitting above the gray favors a positive PNA that month, below it a negative one. Individual months are noisy, so look for a consistent lean.
Source: NOAA Climate Prediction Center.
Madden–Julian Oscillation (MJO)
A pulse of tropical thunderstorms that circles the globe every 30 to 60 days. Its phase influences the storm track and atmospheric river activity in the weeks that follow, which makes it useful for sub-seasonal outlooks.
Read the diagram by where the path sits. Inside the small circle the MJO is weak and says little. Outside it, the angle gives the phase (1 to 8, the tropical Pacific and Indian Ocean regions named on the chart), and the farther out the stronger the signal. Compare the two forecasts: when the American and European ensembles agree on the phase and strength, the signal is more trustworthy.

Sources: NOAA Climate Prediction Center and ECMWF (charts © ECMWF, CC BY 4.0).
Pacific Decadal Oscillation (PDO)
The leading pattern of sea surface temperature variability in the North Pacific. It shifts slowly, with phases that often last for years. The chart above shows it back to 1950 to match the ENSO record; the NOAA data go back to 1850. NOAA NCEI describes the two phases this way:
“When SSTs are anomalously cool in the interior North Pacific and warm along the Pacific Coast, and when sea level pressures are below average over the North Pacific, the PDO has a positive value. When the climate anomaly patterns are reversed, with warm SST anomalies in the interior and cool SST anomalies along the North American coast, or above average sea level pressures over the North Pacific, the PDO has a negative value.” (NOAA NCEI)
What it tends to mean for the Northwest
In the negative phase the water along the coast is cool, which has tended to go with cooler, wetter winters and a deeper mountain snowpack in the Pacific Northwest; the positive phase has leaned warmer, with a thinner snowpack (for example, Mantua et al. 1997). The higher pressure of a negative phase sits over the North Pacific interior, so it is not by itself a ridge over the coast. The effect is modest, and it is clearest when ENSO is in the same direction: when the two disagree, as they do when a negative PDO meets El Niño, the signals partly cancel and the odds shift very little.
More: NOAA NCEI PDO index.
What we plan to add
Our own plots of each index, with the current value, its recent history and a plain-language read on what it suggests for the Cascades. These feed the Reading the Tea Leaves predictor.